Alpha Shape script for ImageJ/FIJI
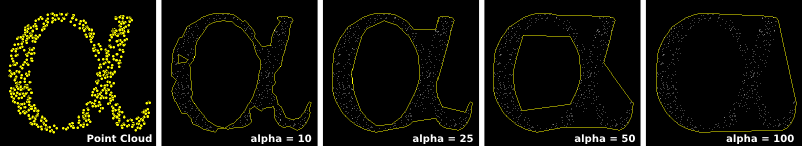
This script (Alpha_Shape.ijm) calculates a regularized alpha shape from a point selection. It works analogously to the “Convex Hull” command but can produce concave and hollow shapes depending on the particular point selection and the alpha value you select. The output is a composite selection of the alpha shape.
An example, showing the results of increasing values of alpha:
Known issues:
-
The script becomes progressively slower as more points are selected. It can take a few minutes to complete once the number of points exceeds 200 or so. Selections of over 1000 points take hours. If you have a large dataset, it may be more efficient to export the point cloud and use a fast specialized program such as hull to calculate the alpha shape.
-
The script uses and will delete any preexisting contents of the ImageJ/FIJI ROI manager.
Blindfiles 
Filename blinding program: (blindfiles)
Available as a Windows/OS X program or python script.
Takes a directory tree of files as input and creates copies of those files with randomized file names. A tab delimited table linking the new names to the original ones is generated at the same time. You can use this utility if you want to examine/score some files without biasing yourself by knowing their names.
FastQ2SCARF
Python script (FASTQ2SCARF.py) that converts FASTQ sequencing files to Illumina’s SCARF format
Converts from the standard FASTQ format for second-generation sequencing output files to the less-common SCARF format. I used it to produce input files for the SPLINTER pooled INDEL detection program, which requires SCARF input files.
Lineswarm
A graphing function (lineswarm.R) for the R statistical environment
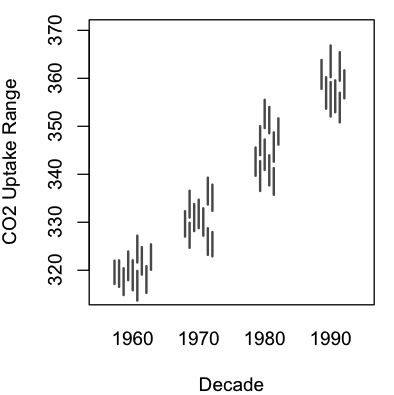
A modification to the excellent beeswarm package for R. Allows swarming of lines (i.e. lines defined by pairs of values) in addition to points.
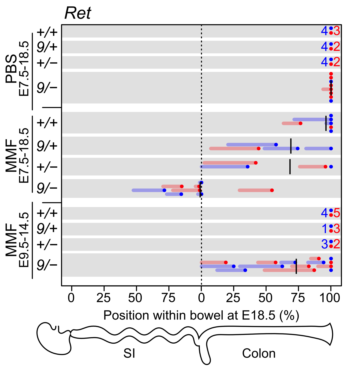
The syntax of lineswarm is essentially identical to beeswarm, but requires you to set an additional parameter: pwdropline, which is a second independent variable defining the end of each line to plot.
| An example, using R’s sample data (R code here): | Real-world use: this figure, panels C and F. |
|---|---|
 |
 |
Supervised Ball-truncated Voronoi Segmentation and Scoring.
Note: This script is obsolete. It was written in the early 2010s, prior to QuPath’s availability. In the modern age, I would use QuPath’s cell detection functions to do this.
SBTVS_Multichannel_Scorer.ijm: an ImageJ/FIJI script
Supervised segmentation of cells followed by scoring of their total fluoresence intensities in multichannel images. This script requires a multichannel image, and one channel should be a nuclear stain such as DAPI, Hoechst, H2B-fusions, NLS-fusions, etc.
This script semgents the cells and then allows you to review the segmentation and delete/correct any errors before recording the raw fluoresence intensity of each cell in each channel.
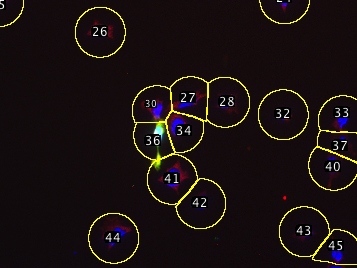
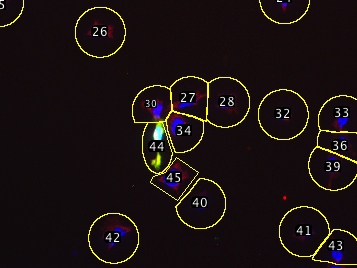
The segmentation algorithm has a few tricks: It startes with a nuclear stain to pick each cell’s center, then draws a circle around that point large enough to capture the cytoplasm (you provide the script with a maximum diameter). If two circles touch (e.g. clumped cells) the script trims the circles down at the point of contact so each segmented region generally encompasses only a single cell. Since this produces different-sized areas, the script asks for a threshold which serves to precisely outline the pixels that belong to the cell, while the segmented region essentially serves to exclude other nearby cells. This procedure still does not correctly handle all situations, but errors can be easily corrected (see below) manually, since the script adds all shapes to the ROI manager. Erroneous shapes can be deleted and manually-drawn replacements added to the ROI manager. These corrected shapes will then be scored with the automatically segmented ones.
In this automatic but supervised fashion you can score thousands of cells in a few minutes.
| Example multichannel image | After deleting incorrect ROIs |
|---|---|
| (DAPI/GFP/anti-IMPDH) | and recreating them manually: |
| Automatically segmented, | |
| one major error | |
 |
 |
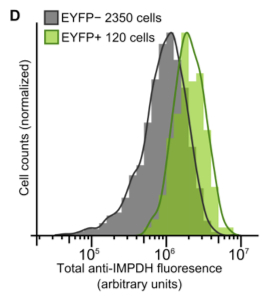
| This script was originally written to measure the quantitative data for this figure: (Supplemental Figure 2D): |
|---|
 |
Miscellaneous ImageJ1/FIJI scripts:
-
Pseudo-flat field (i.e. “shading correction”) an entire image stack (intended for movies) even-out illumination in DIC time-lapse movies where brightness varies across the field of view due to bubbles, the sides of multiwell plates, and other things that interfered with the optics of the microscope during image acquisition.
-
Toggle current channel’s visibility (assign this to a hotkey)
-
Toggle the visibility of all channels except the current channel (assign this to a hotkey)